
I love Pi-Hole and I’ve had a great time using it. Recently I’ve started the play around with Grafana and Prometheus. When I found this exporter I couldn’t resist setting it up. I also didn’t want to use docker and instead use a service in Linux. In this tutorial I am assuming you already have Grafana and Prometheus up and running locally (I have used ubuntu 20.04). There are a lot of guides around and I may do one myself at a later date.
Install pihole-explorer
- Open the terminal on your server and download the latest version of pihole-explorer. wget -c https://github.com/eko/pihole-exporter/releases/latest/download/pihole_exporter-linux-amd6
- Make a directory for pihole-explorer sudo mkdir /opt/pihole_exporter
- Add a user account to run the service sudo useradd -r pihole_exporter
- Move the files to the new directory sudo mv pihole_exporter-linux-amd64 /opt/pihole_exporter
- Change the group permissions to the new pihole user sudo chgrp pihole_exporter /opt/pihole_exporter
- sudo chgrp pihole_exporter /opt/pihole_exporter/pihole_exporter-linux-amd64
- chmod +x /opt/pihole_exporter/pihole_exporter-linux-amd64
- Create a service file for pihole-exporter sudo nano /lib/systemd/system/pihole_exporter.service
- Paste in the following code, replace 10.0.0.4 and xyz with your pihole IP and password.
[Unit]
Description=pihole_exporter

[Service]
ExecStart=/opt/pihole_exporter/pihole_exporter-linux-amd64 -pihole_hostname 10.0.0.4 -pihole_password xyz WorkingDirectory=/opt/pihole_exporter
Restart=always
User=pihole_exporter

[Install]
WantedBy=multi-user.target- Press ctrl + x and type y then enter to save the file
- Reload the system daemon systemctl daemon-reload
- Run the service service pihole_exporter start
- Enable it to run at start up systemctl enable pihole_exporter
- Lastly check the status systemctl status pihole_exporter – press q to exit this view
Setup Prometheus and Grafana
- Open your Prometheus settings file. sudo nano /etc/prometheus/prometheus.yml (Your path may vary depending on how you installed it)
- Under the heading scrape_configs: add the following code
  - job_name: 'pihole'
    static_configs:
- targets: ['localhost:9617']- Press ctrl + x and type y then enter to save the file
- Enter the following to restart prometheus sudo systemctl restart prometheus
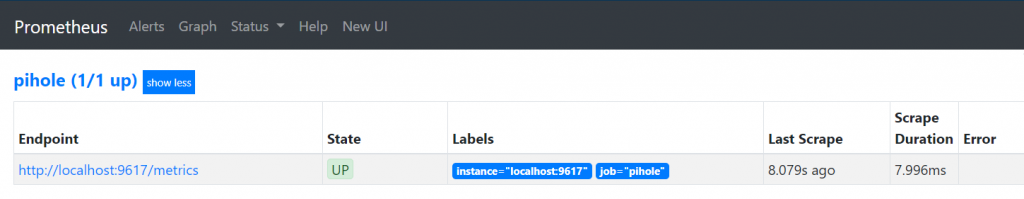
- Go to your Prometheus targets URL and check that the service is up, http://10.0.0.5:9090/classic/targets (your IP will differ)
- If all is working, head to Grafana and select import a dashboard.
- Enter the Dashboard number and press import. 10176

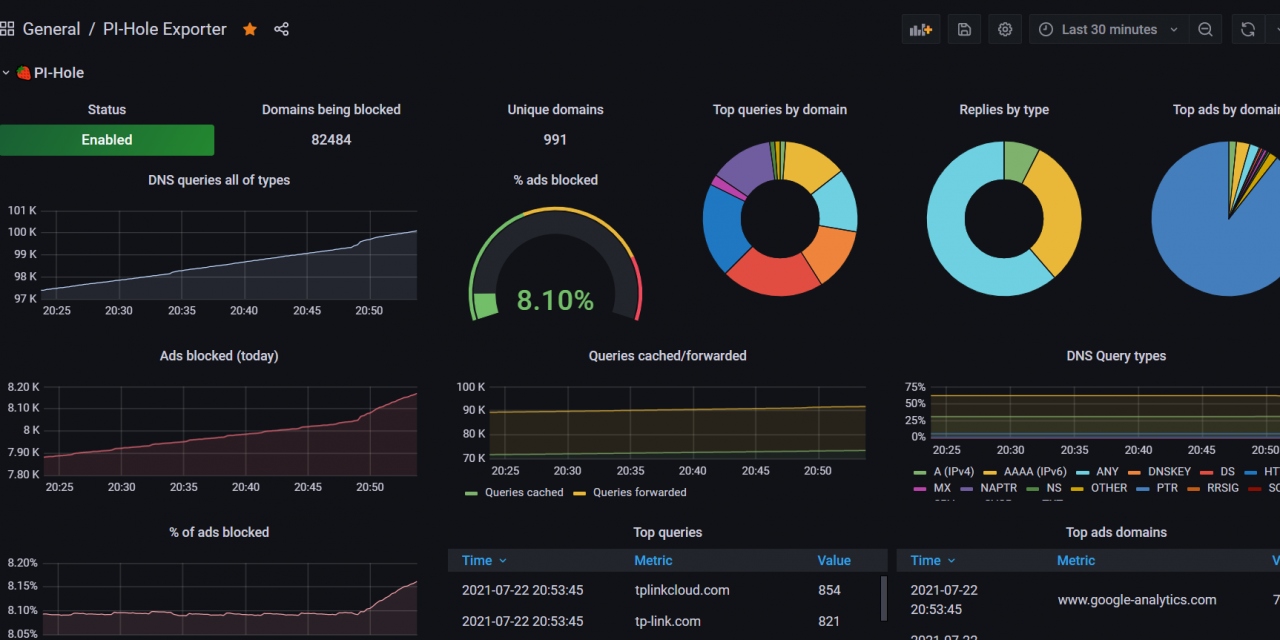
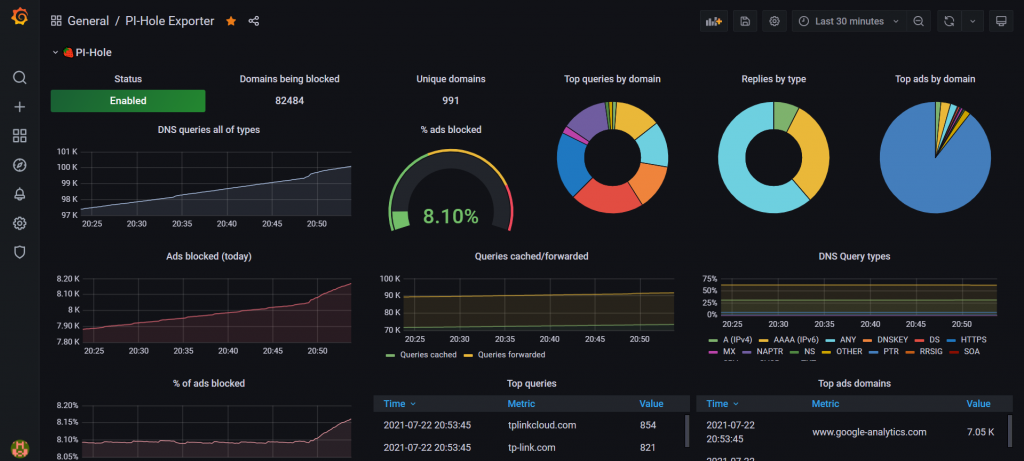
- If everything has worked, you should see the dashboard start to display data.


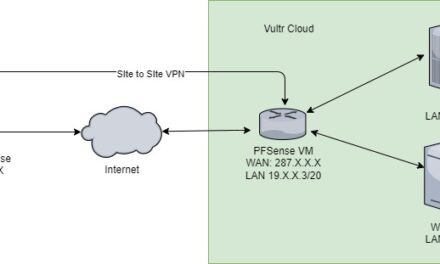
I have two pi-holes running as primary and secondary DNS servers. Is there a way to pull combined data from both into a single dashboard?
Hey Peter,
You would likely need to do some custom editing. You could for example edit each widget’s data source and use a sum of the data from each pi hole. You would also have to add them both to Prometheus.