
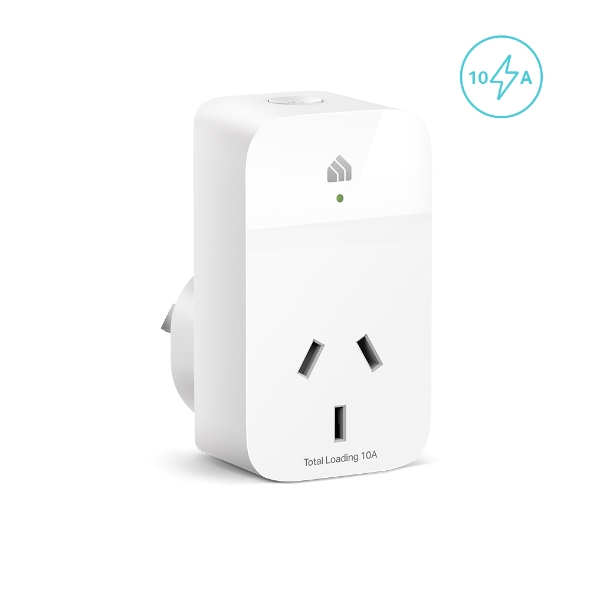
Recently I bought some TP Link Smart Plugs to monitor the energy usage of some equipment in my house. The Kasa app is fine but I wanted a way to see all the usage in one place. I found this great exporter for Prometheus on GitHub. In this tutorial I am assuming you already have Grafana and Prometheus up and running locally (I have used ubuntu 20.04). There are a lot of guides around and I may do one myself at a later date. I am first going to create a service to run this exporter in, it makes it easier for managing later.
Install/Setup tplink-plug-exporter
- Open the terminal on your server and download the latest version of tplink-plug-exporter. wget -c https://github.com/fffonion/tplink-plug-exporter/releases/download/v0.4.0/tplink-plug-exporter_0.4.0_linux_x86_64.tar.gz
- Export the files tar xvf tplink-plug-exporter_0.4.0_linux_x86_64.tar.gz
- Make a directory for tplink-plug-exporter-explorer sudo mkdir /opt/tplink-plug-exporter
- Add a user account to run the service sudo useradd -r tplink-plug-exporter
- Move the files to the new directory sudo mv tplink-plug-exporter /opt/tplink-plug-exporter
- Change the group permissions to the new tplink-plug-exporter user sudo chgrp tplink-plug-exporter /opt/tplink-plug-exporter
- sudo chgrp tplink-plug-exporter /opt/tplink-plug-exporter/tplink-plug-exporter
- Set the file so it can be run chmod +x /opt/tplink-plug-exporter/tplink-plug-exporter
- Create a service file for tplink-plug-exporter sudo nano /lib/systemd/system/tplink-plug-exporter.service
- Paste in the following code.
[Unit]
Description=tplink-plug-exporter

[Service]
ExecStart=/opt/tplink-plug-exporter/tplink-plug-exporter -metrics.listen-addr localhost:9233
WorkingDirectory=/opt/tplink-plug-exporter
Restart=always
User=tplink-plug-exporter

[Install]
WantedBy=multi-user.target- Press ctrl + x and type y then enter to save the file
- Reload the system daemon systemctl daemon-reload
- Run the service service tplink-plug-exporter start
- Enable it to run at start up systemctl enable tplink-plug-exporter
- Lastly check the status systemctl status tplink-plug-exporter – press q to exit this view
Setup Prometheus and Grafana
- Open your Prometheus settings file. sudo nano /etc/prometheus/prometheus.yml (Your path may vary depending on how you installed it)
- Under the heading scrape_configs: add the following code
- Replace the 10.0.0.34 with the IP of your TP-link Plug, you can add more IP’s if needed.
- job_name: 'kasa'
    static_configs:
      - targets:
      # IP of your smart plugs
        - 10.0.0.34
    metrics_path: /scrape
    relabel_configs:
      - source_labels : [__address__]
        target_label: __param_target
      - source_labels: [__param_target]
        target_label: instance
      - target_label: __address__
        # IP of the exporter
        replacement: localhost:9233

# scrape kasa_exporter itself
  - job_name: 'kasa_exporter'
    static_configs:
      - targets:
        # IP of the exporter
- localhost:9233- Press ctrl + x and type y then enter to save the file
- Enter the following to restart prometheus sudo systemctl restart prometheus
- Go to your Prometheus targets URL and check that the service is up, http://10.0.0.5:9090/classic/targets (your IP will differ)

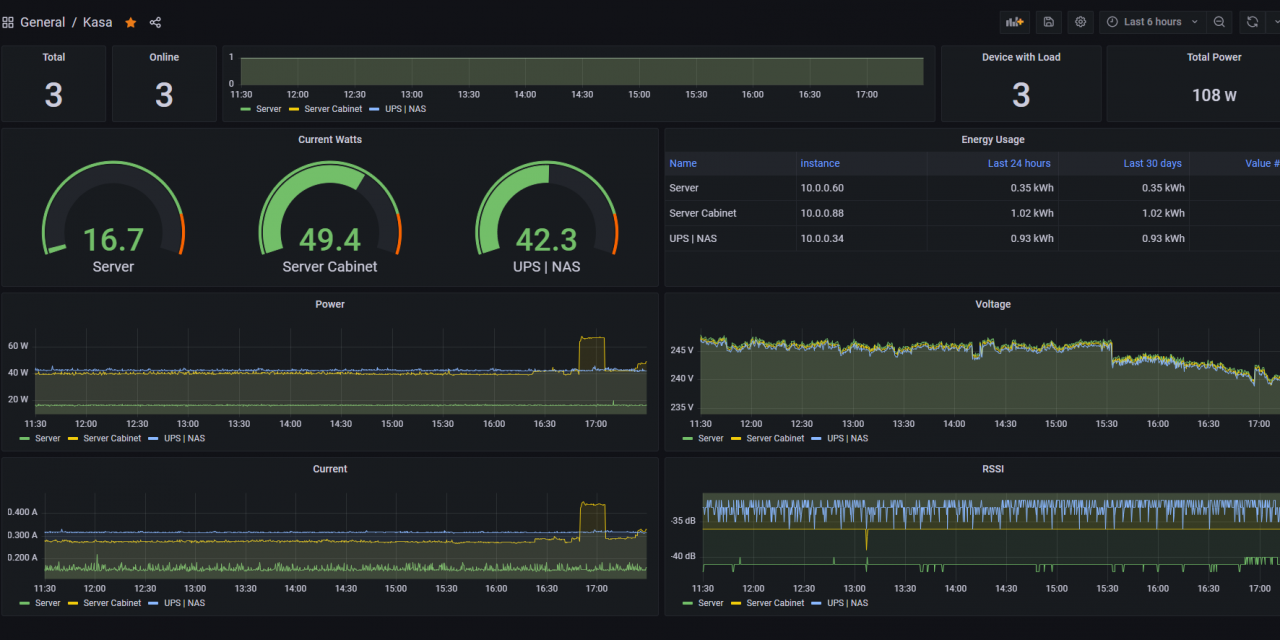
- If all is working, head to Grafana and select import a dashboard. Enter the number 10957
- Enter the Dashboard number and press import.

- If everything has worked, you should see the dashboard start to display data. (I have also added an additional widget to mine)


Recent Comments